.
# Table of Contents
### Introduction
{% content-ref url="/pages/UUfzJQCJfBJkDlWKqJzP" %}
[Introduction](/intro/introduction)
{% endcontent-ref %}
{% content-ref url="/pages/-Mk100xTibh60i4B4hh5" %}
[Approach](/intro/approach)
{% endcontent-ref %}
### Research
{% content-ref url="/pages/QnAjnDpWNeLq3byeSs0f" %}
[Stakeholder Engagement](/research/stakeholder-engagement)
{% endcontent-ref %}
{% content-ref url="/pages/xvBe7kNUVpaSoOZmP2UZ" %}
[Existing Tools Review](/research/existing-tools-review)
{% endcontent-ref %}
{% content-ref url="/pages/2WBED6ZZ1KZBOMSztYG4" %}
[Platform Requirements](/research/platform-requirements)
{% endcontent-ref %}
### Solution
{% content-ref url="/pages/f32XpUwdt5ZV0uHt5uuU" %}
[Personas and Journeys](/solution/personas-and-journeys)
{% endcontent-ref %}
{% content-ref url="/pages/LPvrfjwcHk3nMoTPFzOj" %}
[Blueprint](/solution/blueprint)
{% endcontent-ref %}
{% content-ref url="/pages/kM82P2nTBrDGk528F72O" %}
[Wireframes](/solution/wireframes)
{% endcontent-ref %}
{% content-ref url="/pages/tfP5qi0eQEGxrzvoQJKP" %}
[Platform Architecture](/solution/platform-architecture)
{% endcontent-ref %}
### Way Forward
{% content-ref url="/pages/USOLFW3Itztfke8UnU1x" %}
[Building Blocks](/way-forward/building-blocks)
{% endcontent-ref %}
### Resources
{% content-ref url="/pages/VdhapGrCIWnlB4uqfXbA" %}
[License](/resources/license)
{% endcontent-ref %}
# Introduction
When too much data becomes a problem.
### The Circumstances
The circumstances in which a child grows up strongly influences their outcomes across Scotland. Impacts of child poverty on the attainment of a child which need to be holistically assessed to better understand how it affects them. There are structural inequalities in the resources available to these children and the support provided to best utilise them.
Education and children services have been working on this problems for years to understand the challenges faced by a child growing in the different local contexts by attempting to follow the journey of a child through the system. One way they are trying to achieve this is by interacting with various sources of data and platforms available to them that help understand the same.
### The Obstacles
Even with the knowledge of these challenges, the ability to work with information to solve these is not uniform across the stakeholders. They are faced with numerous obstacles ranging from access to data from all the various sources to ability to bring all the data from various sources together to lack of availability of important data to make key decisions in supporting the children.
The stakeholder are also working in real world settings where the data is not standardized across sources and they have to work with the limited time and data literacy available to them. To overcome these obstacles a central solution is required that enables data analysis, exploration and communication for the core responsibilities of the stakeholders while incorporating various sources of rich datasets available to them.
### The Solution
To build a solution that encompasses all the requirements, all our research lies on the intersection of `data`, `tech`, `design` and `social science` to understand all aspects of the ecosystem and suggest solutions that strengthen the course of civic engagements.
Through our research we interacted with the stakeholders to understand their role in the ecosystem, the tools their are engaging with, their current xperiences and their aspirations for an ideal future. Through all these inputs were able to identify the preferences of various stakeholders and their requirements from a new solution.
This reports highlights our learnings from this work, and envisions a "one stop shop" platform where all stakeholders can come together and co-create solution to address the poverrty related attainment gap across the Northern Alliance Region of Scotland.
# Background
The inception of the research project.
> **Source** : [Data for Children Collaborative with UNICEF](https://www.dataforchildrencollaborative.com/poverty/northern-alliance)
### **The Issue**
The places where children and young people grow up in are extremely diverse and can greatly influence the outcomes of children and families across Scotland. Children and families can be negatively affected by a broad range of circumstances, including poverty and the associated impacts of it. Nonetheless, each place has their own unique context to consider when holistically assessing the relationship between child poverty and attainment and determining the actions required to mitigate the effects. Yet, the extent to which we can understand the impact of these place-based characteristics can be limited by the availability and density of data and information at hand.
### **Why Does it Matter?**
[Article 28 of the UN Convention on the Rights of the Child](https://www.unicef.org.uk/what-we-do/un-convention-child-rights/) states that all children and young person have the right to an education. In addition, the UN Sustainable Development Goals have a target to [ensure inclusive and equitable quality education and promote lifelong learning opportunities for all.](https://sdgs.un.org/goals/goal4)
Education and children services are in a unique position where they can work collaboratively across sectors to reduce structural inequalities and collaborate with a wide range of stakeholders to get it right for every child. This can be facilitated by having a deeper understanding of the mechanisms in which educational attainment can be negatively affected by poverty and subsequently support professionals to design bespoke interventions suitable to their own unique context and achieve excellence and equity of educational outcomes for children and young people.
### The Northern Alliance of Scotland
[The Northern Alliance](https://northernalliance.scot/) is a regional improvement collaborative, spanning across and supporting 8 local authorities and their associated school settings to improve education and reduce the poverty related attainment gap. Within these settings, children, young people and their families live across a diverse range of urban and rural settlements.
# Collaboration
> **Source** : [Data for Children Collaborative with UNICEF](https://www.dataforchildrencollaborative.com/poverty/northern-alliance)
The aim of this collaboration was to determine what data sources and analytical techniques best reflect the challenges of child poverty, and subsequently provide a means to assess the poverty related attainment gap as a result – which will further allow individual school settings, local authorities and other bodies to plan targeted interventions to reduce it.
Developed through the [Impact Collaborations process](https://www.dataforchildrencollaborative.com/impact-collaborations-1), this project has brought together academic expertise from the Fraser of Allander Institute at the [University of Strathclyde](https://www.strath.ac.uk/business/economics/fraserofallanderinstitute/) and [Glasgow Caledonian University](https://www.gcu.ac.uk/), and data science expertise at [CivicDataLab](https://civicdatalab.in/) and [East Neuk Analytics](https://eastneukanalytics.com/). During this initial phase, the team will work in partnership with [Northern Alliance](https://northernalliance.scot/) and the Local Authorities they represent.
The objective within this initial phase is to work with stakeholders to identify the shared knowledge gap across local authorities, identify the most appropriate indicators and map the suitable data sources that can be used at the school catchment aggregation.
### Partners
#### CivicDataLab
[CivicDataLab](https://civicdatalab.in/) is a research lab working on the intersection use data, tech, design and social science to strengthen the course of civic engagements in India. They work to harness the potential of open knowledge movements and better enable citizens to engage in matters of public reform. The aim to grow data and tech literacy of governments, non-profits, think-tanks, media houses, universities, and more to enable data-driven decision making at scale.
#### The Data for Children Collaborative with UNICEF
[The Data for Children Collaborative with UNICEF](https://www.dataforchildrencollaborative.com/) is a unique partnership between UNICEF, The Scottish Government and the University of Edinburgh, hosted by The Edinburgh Futures Institute. In today’s fast-paced technological landscape, where data is a driving force and evidence is vital to decision making, the Collaborative want to use data to produce real-world impacts that help the world’s children. Their goal is to leverage the appropriate data and expertise from our community in order to address existing problems for children using innovative data science techniques.
#### The Fraser of Allander Institute (FAI)
[The Fraser of Allander Institute](https://www.strath.ac.uk/business/economics/fraserofallanderinstitute/]) (FAI) at the University of Strathclyde is a leading independent economic research institute focused on the Scottish economy since 1975.
#### East Neuk Analytics
[East Neuk Analytics](#objectives) supports headteachers to improve their data literacy through training and bespoke tools for their schools. By supporting teachers to improve their confidence in their data led decision-making, it gives them more time to spend with the children and young people in their school.
#### Glasgow Caledonian University
[Glasgow Caledonian University](https://www.gcu.ac.uk/) (GCU) is a vibrant, innovative and multi-award winning University for the Common Good. Their aim is to contribute to society in a manner that embraces yet goes beyond the traditional role of a university. GCU’s For the Common Good commitment is brought to life through their strategy and by the actions of staff, students and alumni around the world.
# Approach
### The 4 Pillars

CivicDataLab believes in building solutions that harness the potential of open knowledge movements and better enable key stakeholders and citizens to engage in matters of public reform.
To achieve this, all our research lies on the intersection of `data`, `tech`, `design` and `social science` to understand all aspects of the ecosystem and suggest solutions that strengthen the course of civic engagements.
* **Data** : Existing data sources used by key stakeholders to access neccesary information to support pupil in their regions. The nature of these datasets, the usage patterns of these datasets by key stakeholders and what sections of the ecosystem do they solve for.
* **Tech** : The feature of the existing platform and new features requested by the key stakeholders to fullfill their requirements of an ideal solution. The posstible data model, ad platfrom architecture of building such a system at scale.
* **Design** : Tools and platforms engaged by the key stakholders in the local authorities, how they are using these tools and for what puporses. The limitations of these existing tools and what would should be the features of the new solutions offered to them.
* **Social Science** : The most important aspect of the research is to understand the key stakeholders, what they day to day activities look like in the system and how they are interacting with all the pillars above and their requirements for an ideal solution.
You can learn more about how we have employed these four pillars in our work in the research section of this report.
{% content-ref url="/pages/aH9AWEXXS4HBN0plU92o" %}
[Research](/research/stakeholder-engagement)
{% endcontent-ref %}
### Open by Default
We at CivicDataLab strongly believe that to build solutions that work for the community, the community should play an intergral role in their development. One key approach in achieving this goal is making all of our work open by default. All the work produced throughout this research has been made available under open licenses to use, reuse, contribute and extend the findings of our work with the community.
Keeping all our work open benefits us and the vision of the work in a couple of ways:
* Creating transparency in the approach taken for the research, enabling contributions.
* Ensuring that the solution co-created with the stakeholders is also co-owned by them.
* Extending the work beyond the orignal creaters to take the efforts forward.
#### Licenses
**Content**
The research process and outputs in it's entirety is licensed under a [Creative Commons Attribution 4.0 International License](http://creativecommons.org/licenses/by/4.0/).
**Code**
The code writen to test and prototype envision solutions is kept under the [GNU Affero General Public License](https://www.gnu.org/licenses/agpl-3.0.en.html).
# Stakeholder Engagement
The first and probably the most important step in thinking about a new solution is to engage with the stakeholders and understand their experiences in the existing ecosystem. Identifying their pain areas, challenges, aspirations, behaviours, patterns which can guide the direction of the project.
This helps us understand the landscape beyond the problem statement. Which in our case was:
> How do we use novel data sets and techniques to effectively understand the impact of child poverty on education within urban and rural contexts?
The main objective of engaging with the stakeholders was to explore the unknown and unlock new possibilities to address the realities faced by them.
For the ambitions of this project, we were introduced to four types of primary stakeholders:
* Attainment Advisors
* Educational Psychologists
* School Leaders
* Quality Improvement Managers / Quality Improvement Officers / Education Support Officers
You can read briefly about the roles and responsibilities of these stakeholders [here](https://github.com/The-Data-for-Children-Collaborative/noral-project/blob/main/_resources/stakeholders.md).
### Framework
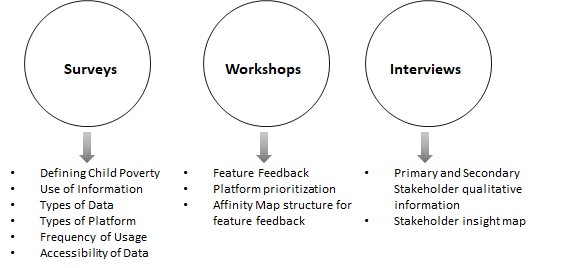
To understand the experiences of these stakeholders better, multiple touchpoints were setup with with different objectives capture to comprehensive picture of ecosystem.
The following approach was undertaken:
* **Survey** : As a first step of the stakeholder research a survey was conducted to better understand the current landscape, primary users, their aspirations and challenges faced along the way.
{% content-ref url="/pages/loNiGt8C7qadUsRZu7pc" %}
[Survey](/research/stakeholder-engagement/survey)
{% endcontent-ref %}
* **Workshop** : Following the initial survey, a workshop was conducted with the key stakeholders to get inputs on the data and tools most frequently used by the stakeholders, the challenges faced by them. Their inputs were also collected on certain possible features of a new solution.
{% content-ref url="/pages/c0aK31SDJaXYs7tHOb4s" %}
[Workshop](/research/stakeholder-engagement/workshop)
{% endcontent-ref %}
* **Interviews** : Individual interviews were conducted with the primary and secondary stakeholders to understand their daily activities, what kind of information they interact with, their challenges and aspiration to envision what a way forward could look like.
{% content-ref url="/pages/ky4dyaAUVz8fXxEzjsfG" %}
[Interviews](/research/stakeholder-engagement/interviews)
{% endcontent-ref %}
### Consolidation
All the information generated from these interactions with the stakeholders was consildated to create Personas and Jounreys to envision the ideal solution for their needs and aspirations.
{% content-ref url="/pages/f32XpUwdt5ZV0uHt5uuU" %}
[Personas and Journeys](/solution/personas-and-journeys)
{% endcontent-ref %}
You can read about the detailed description of the stakeholder research framework [here](https://github.com/The-Data-for-Children-Collaborative/noral-user-research/blob/main/research/research-framework.md) and find the research outputs from each of the steps [here](https://github.com/The-Data-for-Children-Collaborative/noral-user-research/tree/main/research).
### Confidentiality
The following measures were put in place to ensure the privacy and confidentiality of information of the key stakeholders in any publically shared information about the research, solution:
* The records from all the stakeholder engagements will be kept confidential, with access to files only the core team working on the project, has access to any digital files.
* All digital files, transcripts, and summaries will be stored separately from any names or other direct identification of participants.
* When the results of the research will be published or discussed in public domain, no personally identifiable information about any of the individuals will be used.
* Any information quoted in research outputs from these surveys will be done with the permission of the stakeholders and anonymized as requested.
* The information provided by the stakeholders will be maintained for at least three years from the date of submission.
# Survey
As a first step of the stakeholder research a [survey](https://github.com/The-Data-for-Children-Collaborative/noral-user-research/blob/main/research/01-stakeholder-survey/01-01-stakeholder-survey.md) was conducted to better understand the current landscape, primary users, their aspirations and challenges faced along the way. This information also played an important role in planning for the upcoming engagements with the key stakeholders.
### Summary
The survey recieved `13` responses in total, you can read about the composition of the respondents [here](#summary). Below is the summary of key findings from they survey.
#### Stakeholder Inputs
`#1` : **How can we effectively understand the impact of child poverty on education within urban and rural contexts?**
* Helping school professionals by making the full range of data and services available that is relevant to their priorities.
* Taking a holistic approach to tracking a young person's school journey, considering community, family and child together.
* Re-defining poverty which takes into account, hidden poverty and understanding various aspects of poverty across the child's day, week and year.
* Considering wider factors than just SIMD and FSM, to bring in the local contexts for rural and remote geographies.
* Developing systems to support authority-level and cluster-level analysis of patterns while maintaining the privacy and security of individuals.
`#2` - **What changes in the data and/or information ecosystem would have a positive impact in the education system?**
* Building a central access system for stakeholders to access around pupils to build a holistic view over time which includes various socio-economic indicators.
* Consitentcy of approach for LAs to see similar datasets / platforms to access from a National level.
* Making more types of data available like longitudinal data that measure value added and impact over years.
* Designing a better system that frees up schools to work on creative solutions, and creates higher levels of awareness about the impact of poverty.
`#3` - **How could any data and/or information available on the open education-based data platform we are developing be made more actionable for you?**
* Features like trends analysis, comparison of establishments and refion, benchmarking across regions and measure the effects of multiple factors.
* Fostering a data driven culture by promoting networking and sharing of best practices amongst Local Authorities and Services.
* Making data clearer and more actionable in use, reducing the risk of disconnected and redundant data and addimg more information about the local area.
**Resources**
Data and platform sources most frequently accessed by the respondents.
| Data | Platforms |
| -------------------------------------------------------------------------------------------------------------------------------------------------------------------------------------------------------------------------------------------- | ------------------------------------------------------------------------------------------------------------------------------------------------------------------------------------------------------------------------------ |
| Specific:
- Achievement of Curriculum for Excellence levels (ACEL)
- Scottish Planning Policy (SPP) Data
- National Improvement Framework (NIF)
- PIPS: Test Data
- Datahub
| Specific:
- Insight
- BGE Benchmarking Tool
- SEEMiS Group; Education Management Information System (MIS)
- Scottish National Standardised Assessments (SNSA)
- National Risk Framework
|
| Others:
- School Attendance and Exclusion
- School Tracking Spreadsheet
- School Data Packs
- Children's Mental Health
- Attainment Data through LA at authority level and school level exam results.
| Others:
- Local Authority Dashboard
- School Dashboard
|
> All the resources around the stakeholder survey conducted, the methodology and the outputs can be found [here](https://github.com/The-Data-for-Children-Collaborative/noral-user-research/tree/main/research/01-stakeholder-survey).
### Methodology
* The survey was conducted using a Free and Open Source Software (FOSS), [Mautic](https://www.mautic.org/).
* The survey was shared with stakeholders over e-mail through a web address.
* The approximate time for completing this survey is about 15-20 minutes.
# Workshop
Following the initial [Stakeholder Survey](https://github.com/The-Data-for-Children-Collaborative/noral-user-research/blob/main/research/01-stakeholder-survey), a workshop was conducted with the key stakeholders to inform our knowledge on the following fronts:
1. The data, tools and resources most frequently accessed by the stakeholders and their experiences with the same.
2. The challenges faced by them while engaging with the existing sources of information and systems in the current form.
3. Their inputs on certain possible features for a new solution and how would like to to engage with these features.
> Further details about the key objectives of the workshop, its format, participants and more can be found at the following [link](https://github.com/The-Data-for-Children-Collaborative/noral-user-research/blob/main/research/02-stakeholder-workshop/02-01-workshop.md).
### Summary
#### Tool Feedback
All the stakeholders were asked to share the most frequently used tools and review them on the following criteria:
* Things they liked about the tool / platform.
* Things they didn't like about the tool / platform.
* Things they would like to improve about the tool / platform.
All the findings from the section of the workshop was consolidated along with an in-depth design audit of the most frequently mentioned platforms.
{% content-ref url="/pages/agilC7ZmG0BeyVxbgbyx" %}
[User Feedback](/research/existing-tools-review/user-feedback)
{% endcontent-ref %}
#### Feature Feedback
The second part of the workshop focused on better understanding the challenges the users are facing and how would they like to solve for the same. The users were asked to share inputs certain suggested features and the what they would like to see as the solutions.
The features discussed were as follows:
* [Information Mapping](https://github.com/The-Data-for-Children-Collaborative/noral-user-research/blob/main/research/02-stakeholder-workshop/feature-feedback/001-information-mapping.md) : Layering numerous sources of information in an area around education (child, teacher, parents, etc.) to services available (healthcare, financing, justice, etc.) for better tracking the factors affecting the education of a child.
* [Comparative Analysis](https://github.com/The-Data-for-Children-Collaborative/noral-user-research/blob/main/research/02-stakeholder-workshop/feature-feedback/002-comparative-analysis.md) : Ability to compare areas, schools, authorities on availability of resources (financing, facilities, etc.) and outcomes of the education system (attainment. etc.)
* [Data Collection](https://github.com/The-Data-for-Children-Collaborative/noral-user-research/blob/main/research/02-stakeholder-workshop/feature-feedback/003-data-collection.md) : Mechanism to collect and store data from numerous on-ground collection methodologies in a central location linked to various other information about the area.
* [Open Access](https://github.com/The-Data-for-Children-Collaborative/noral-user-research/blob/main/research/02-stakeholder-workshop/feature-feedback/004-open-access.md) : Creating an open data platform where all public interest information is available to key stakeholders and citizens to better engage with their community.
* [Data Stories](https://github.com/The-Data-for-Children-Collaborative/noral-user-research/blob/main/research/02-stakeholder-workshop/feature-feedback/005-data-stories.md) : Ability to showcase specific analyses, reports, stories, etc. for various use cases with the methodology and the data made accesible for further research.
* [Capacity Building](https://github.com/The-Data-for-Children-Collaborative/noral-user-research/blob/main/research/02-stakeholder-workshop/feature-feedback/006-capacity-building.md) : Enabling key stakeholders and community at large to better adopt / use the tool and technologies, through various resources embedded into the platform.
The raw outputs from the workshop [thematically bucketed](https://github.com/The-Data-for-Children-Collaborative/noral-user-research/blob/main/research/02-stakeholder-workshop/02-03-feature-feedback.pdf) through the **Affinity Mapping** exercise.
> Affinity Diagrams can help you bundle and cluster large bodies of information, facts, ethnographic research, ideas from brainstorms, user opinions, user needs, insights, design issues, etc. This method will help you name, rank and understand relations between groups of information.
>
> For this reason, this method is also known as “Space Saturate and Group”. The term “saturate” relates to the method in which everyone covers or saturates the “space” with images and notes, in order to create a wall of information, to inform, and start “grouping” the following problem-defining process.
>
> This is a great method which can, if you follow the step-by-step process which we’ve described, surprisingly and straightforwardly create an overview and synthesize your findings. It’s important that you remember to sum up the major insights, user needs, pain points, gaps, etc.

The feedback for each individual feature has been consolidated [here](https://github.com/The-Data-for-Children-Collaborative/noral-user-research/tree/main/research/02-stakeholder-workshop/feature-feedback). This feedback was used to explore the possible tools and technologies that can be used to build the final solution.
{% content-ref url="/pages/XouYlqQchbTfr6RQshZW" %}
[Features](/research/platform-requirements/features)
{% endcontent-ref %}
### Methodology
* The workshop was conducted using collaboration tool, [MURAL](https://www.mural.co/).
* The stakeholders were divided in groups of 3-5 with varying roles and experiences.
* Each group was moderated by a project team member to [conduct the workshop](https://github.com/The-Data-for-Children-Collaborative/noral-user-research/blob/main/research/02-stakeholder-workshop/02-02-template.pdf).
# Interviews
Through the survey and workshop, we were able to collect intergral information about the current landscape and how stakeholders are interacting with it. With the personal interviews, we wanted to dive deeper into the roles and responsiblities of individuals, the role existing data and system plays in their workflows, and what would an ideal system look like for them.
The rationale for taking such an approach was to understand how a new solution can fit into the existing workflows of the key stakeholders and simplify it, rather than expecting them to modify their approaches which have been cultivated and refined over time.
### **Script**
The following were the key areas of discussion with the Stakeholders during the interviews:
* Role of the stakeholder (What is the stakeholder accountable for in the ecosystem)
* What does a working day look like for the stakeholder? (What all activity they conduct or are involved in)
* What kind of data sets does the stakeholder interact with? (Names and description of data sets)
* How is that data beneficial for the stakeholder? (What purpose does the data solve and how does the stakeholder take corrective action based on it)
* What all challenges are faced by the stakeholder with respect to the ecosystem, frameworks or data?
* Dream and aspiration with respect to data and ecosystem (Expectations)
> The final script for the personal interviews can be accessed [here](https://github.com/The-Data-for-Children-Collaborative/noral-user-research/blob/main/03-stakeholder-interviews/interview-script.md).
### Output
All the information from the interviews was synthesied and captured in Stakeholder Insight Maps capturing the **roles and responsiblities**, **type of information** they ineract with, **challenges faced** and **aspirations of a dream ecosystem**.

| Feature | Description | Tools |
|---|
| Data Analysis | Tools to enable using the data behind existing visualisations on a platform and building custom visualisations and dashboards to use in their local context. | Metabase (Demo Link) RAWGraphs (Demo Link) |
| Data Collection | A mechanism to collect and store data related to additional information required around child, school, community and more. | ODK (Demo Link) |
| Data Stories | Capability to use existing data and visualisations, and stitch a naarative around the same which can be published on the platform. | Ghost (Demo Link) |
| Capacity Building | Ability to collaborate with other stakholders on the platform, share your findings and enable others to build their knowledge. | Discourse |
| Comparative Analysis | Ability to compare areas, schools, authorities on availability of resources (financing, facilities, etc.) and outcomes of the education system (attainment. etc.) | D3.js Apache ECharts Chart.js |
| Identity Provider | An identity provider is a tool used to enable login and access to all the systems within the platform. It can alse be used as authorization tool to manage access to relevant tool/data accross the system. | Keycloak |
> The entire research process and its outcomes to identify the toolkit can be found [here](https://github.com/The-Data-for-Children-Collaborative/noral-tech-research).
### Way Forward
Using the requirements set for the features by the key stakeholders and the tools seclected to achieve the same, a platform architecture was devised for the new proposed solution.
{% content-ref url="/pages/tfP5qi0eQEGxrzvoQJKP" %}
[Platform Architecture](/solution/platform-architecture)
{% endcontent-ref %}
# Data Model
An important step in understanding the requirements of the stakeholders was to decipher their relationship with data and what datasets they use in their decision making process. This information helps us create the most efficient systwem possible to better serve the data to the key stakeholders.
### Data Sources
Access to data is dependent on multiple factors like availability, access, usability, and more. For the state of work during this research, we had limited information around what datasets we will use and the role they will play in the final dashboard.
Keeping the following in mind, the data model assumptions were based on the following two sources:
* Research led by University of Strathclyde to identify key datasets that will help resolve the needs of the key stakeholders. The final lists of probable datasets can be found [here](https://github.com/The-Data-for-Children-Collaborative/noral-tech-research/blob/main/information-mapping/DATA%20SOURCES%2006-08.xlsx).
* School level including information around techers, children, familities, communioties and more to identify the the journey of a child through the system.
All the datasets were either agreegate at a geographical granularity like, Data Zone, Regional Parliamentary Constituency, Local Authority, Postcode, Admin Area, National Level or at an Individual or an Individual family level. Alongside all this information, the [Common Education Data Standards](https://ceds.ed.gov/Default.aspx) were also reffered to understand what will be the best way to store data around a child in the education setting.
### Data Types
All the possible data described above can belong to one of the following buckets:
1. **Periodic** : Includes data that is usually changed/updated over a period of time and can contain Personally Identifiable Information (PII). Eg: budget allocation, population, expenses etc.
2. **Seldomly Updated** : Includes data that does not get updated frequently. May contain PII. Eg: highest education qualifications, reasons for dropping out of school etc.
3. **Facts** : Facts are data that remain unchanged. No PII. Eg: address of a school, regions, etc.
### Model
The following information around data sources, standards and data types guide the data model to possibly be in the following structure.

# Personas and Journeys
### Personas
Data generated from key stakeholder during interviews highlighted their individual roles and responsibilities along with their challenges and aspirations. The data gathered was clustered into inputs and insights to form a set of target primary and secondary stakeholder requirements.
Creating personas helps to understand users' needs, experiences, behaviours and goals. It can help to recognise that different people have different needs and expectations, and it can also help to identify with the user you're designing for. Personas can be supported with Stakeholder Insight Map generated from Stakeholder Interviews.
{% content-ref url="/pages/ky4dyaAUVz8fXxEzjsfG" %}
[Interviews](/research/stakeholder-engagement/interviews)
{% endcontent-ref %}
#### **Framework**

The personas contain the following information about the stakeholders:
* **Name**: Could be realistic, could be taken from an actual customer, or it could be a descriptive handle like “Sally the Thrift-shopper.”
* **Job Responsibilities**: Provide details related to roles and responsibilities.
* **Photo**: It always helps to put a face to a name. Stock photos are fine, but avoid photos of celebrities, co-workers or other familiar faces that may come with built-in connotations and assumptions. The idea is creating a new, original identity.
* **Personal Quote / Motto**: Just like a photo, this helps flesh out the persona to make them seem more real.
* **Bio**: Give a little backstory to make the person relatable. What was their childhood like? Why did they choose their current job? How do they spend their free time? These tiny details could influence strategic choices down the road.
* **Demographics**: Age, sex, income, location—whatever attributes are relevant to your industry. Job title is particularly important, considering its business and financial implications.
* **Personality Traits/Self initiatives**: People with low attention spans want faster site designs. Cautious people are most likely to compare shops. Personality traits are one of the most useful features of personas, so choose these with care.
* **Motivations** (Specifically to what data is for them): Like personality traits, this helps you get inside the customer’s head and understand how they think. For example, would a customer be more likely to buy a product that improves their career or their personal life? It depends on which motivates them more.
* **Frustrations / Challenges**: The scope of these is in direct relation to your needs. A lifestyle company would keep to general life and career goals, while a tech company could hone in on more specific goals like tasks they hope to accomplish with their software.
* **Preferred Platforms**: You can tell a lot about a person based on which brands they like and what kind of people influence their decisions. You can also look at those brands’ marketing strategies to see if their tactics might apply to you as well. · **Goals**: Dream Ecosystem or Dream platform to help them take data driven decisions
### Journeys
Data generated from Stakeholder Surveys and Workshops primarily addressed Stakeholder preferences in terms of platform use and feature feedback. These references needed a prioritization framework to develop the user journeys for each stakeholder.
#### **MosCoW Prioritization Framework**
MoSCoW prioritization, also known as the MoSCoW method or MoSCoW analysis, is a popular prioritization technique for managing requirements. The method is commonly used to help key stakeholders understand the significance of initiatives in a specific release. MoSCoW stands for four different categories of initiatives: must-haves, should-haves, could-haves, and will not have.
MoSCoW prioritization, helps in feature prioritization for the platform. Features can be prioritized for each stakeholder based on their requirements and needs. This prioritization will be developed based on the qualitative comments / resources received from the interviews and workshops.


Based on these Stakeholder Prioritization Framework and User Personas we develop the User Journeys maps for each stakeholder.
A **User Journey Map** (also known as a customer journey map) is a diagram that visually illustrates the user flow through your platform, starting with initial contact or discovery, and continuing through the process of engagement into long-term loyalty and advocacy.
The process of mapping their journey encourages and reminds them to consider the entire user experience: their feelings, questions and needs while they interact with the platform. It’s used for understanding and addressing customer needs and pain points. What is the user thinking about and what are they hoping to achieve?
### Outputs
The Personas and Journeys for all the key primary and secondary stakeholders are below.
{% tabs %}
{% tab title="Attainment Advisors" %}

{% endtab %}
{% tab title="Educational Psychologists" %}

{% endtab %}
{% tab title="Head Teachers" %}

{% endtab %}
{% tab title="Quality Imporvement Managers" %}

{% endtab %}
{% tab title="Research Support" %}

{% endtab %}
{% endtabs %}
### Way Forward
Stakeholder analysis uncovers and removes multiple barriers in understanding the project's progression, stakeholder analysis. It also eliminates the roadblocks in releasing successful projects by getting information about project supporters, opponents, and their levels of importance in the project. By using the consolidation methods of personas and user journeys we plan to achieve the following steps ahead:
1. User journeys will help in further building wireframes of each stakeholder for the platform.
2. It will address the needs and aspiration along with user action which the platform can cover.
3. It will also scope the space of opportunities that can be achieved as per user needs.
# Blueprint
The interviews helped us understand everyday processes of the key stakeholders better and generate User Personas and Journeys articulating your requirements from the new solution. Information generated from these interviews spoke about the their roles and responsibilities along with their challenges and aspirations in the system.
{% content-ref url="/pages/f32XpUwdt5ZV0uHt5uuU" %}
[Personas and Journeys](/solution/personas-and-journeys)
{% endcontent-ref %}
Similarly, we conducted comprehensive Design Audits of the existing platforms used by the key stakeholders, thoroughly examining all elements of the digital product based on their business objectives, metrics, and usability standards. These listed down the areas of improvement and recommend solutions to improve the overall experience.
{% content-ref url="/pages/Hf8jdYTdguLTqIpn0py6" %}
[Design Audit](/research/existing-tools-review/design-audit)
{% endcontent-ref %}
To understand the requirements of the new suggested solution we borrow our learnings from the user personas / journeys and design audit to define the broad feature set and functionalities. These functionalities are compared to the existing tools in the ecosystem to identify the strengths, gaps and build according to that information.
### **Comparative Analysis**
A comparative analysis is a strategy where you identify major existing platforms which are trying or have tried to solve problems for more or less the same problem statement. You compare common features for each platform whether they stand in advantage or disadvantage for the users. Also not to forget special features offered by each platform which are their USPs .
Advantages of Comparative Analysis:
* Comparative analysis can reveal broad trends in the existing platform , again providing the advantage of being able to spot opportunities for differentiating dos and don'ts.
* Helps you identify your solutions unique value proposition and what makes your solution different from others.
* Provides you with a benchmark against which you can measure your solution success.

By conducting the comparative analysis of the existing platforms we derived feature level comparison of what the existing platforms has to offer. Analysis was done on common feature to feature comparison keeping in mind the most important and necessary features that are accessed by the users. These exercises helped us understand the following questions:
* What is available for the user?
* What is working for the user?
* What can be changed ?
* What can be combined ?
* What can be added?
The comparative analysis of the existing platforms to envision a new solution can be found below:

### Feature List
During the stakeholderinterviews every stakeholder shared their narrative about the platform they have worked with and platform that they aspire to work with.
Few terms that constantly came forward as their aspirations like ‘One Stop Shop, Data literacy for all or Data standardization etc.’ These suggestions we have picked and have tried working further which are included as our features or functions in the new solution.

### Problem Statement
Every good solution starts with a good problem statement hence we decided to work with 5 W and 1 H Framework. It stands for Who, What, When, Where, Why, and How. Asking relevant questions starting with these interrogative words can streamline the problem solving process. The 5 W 1H framework also sets the context to the bigger picture for which we are trying to solve the problem.
**Defining the Problem Statement**
> ***What - What starts by defining what the problem is?***
To bridge the gap between access to information which can assist stakeholders to understand the attainment related gap around children due to poverty.
> ***Who - Who is trying to solve the problem?***
[CivicDataLab](https://civicdatalab.in/) is partnering with [The Data for Children Collaborative](https://www.dataforchildrencollaborative.com/) to determine what data sources and techniques can best reflect the challenges of child poverty, and subsequently provide means to assess poverty related attainment gaps.
> ***Where - Where is the problem situated?***
The problem is addressed across the Northern Alliance region of Scotland
> ***Whom - For whom are we trying to solve the problem?***
The Northern Alliance Education system has Primary and Secondary stakeholders. Primary stakeholders are ones who have direct engagement and impact with systems like Attainment Advisors, Quality Improvement Officers , Head Teachers and Educational Psychologists. Secondary stakeholders can be defined as stakeholders who have indirect effect or impact like Research Assistants, NIF advisors etc.
> ***Why - What is the purpose of Solving this problem?***
The major goal here is to enable key stakeholders to use data in understanding the role of poverty in a child’s education.
> ***How - How are we trying to address this problem?***
The problem can be addressed by leveraging a platform that caters to individual needs of the stakeholders and empowers them to share their learnings.
### Scoping
By defining the problem statement it helped us to define the purpose and objective of the larger context for which we are solving the problem for. It also helped in scoping the future path to build the narrative for the proposed new solution which we will see below. Through these exercises, we were able to identify the following key areas for the envisioned solution.

> Ensuring **Security and Privacy** as the Data around children and Education system is extremely sensitive

> **Map view** enhances layering of various information related to the stakeholder in a map view. It can be data of the local authority or school which is plotted on the map and provide additional information. Users connect to geographic information on higher basis

> **Dashboards** caters to Key performance Indicators for better forecasting and decision making which will help the stakeholders to be vigilant and thoughtful

> The power to empower our users is leveraged by **Data Explorer**. It allows users to explore and showcase specific analyses, reports, stories, etc. for various use cases with the methodology and the data made accessible for further research.

> **Benchmarking** is an asset for users to identify the performance of the systems with which they are associated in comparison to other hierarchical systems.This can happen through our Data Comparator

> Users are liberated when they can **share** their learning with other sets of users about their experiences, processes and outcomes. It encourages parallel learning within the ecosystem.
The above features were then used and detailed as per the individual user requirements catering to their needs and day to day activities around data and functionality.
Broader level user flows were generated as a brainstorming exercise to understand the following things:
1. Broad level Information Architecture
2. Hierarchy
3. Navigation
4. Functionality of the feature
# Wireframes
Keeping in mind all the insights we have gained from the several stakeholder engagements, we have generated the preliminary wireframes for the suggested platform. With the help of user flows we can envision, how the platform will shape for each stakeholder.

### What are Wireframes?
A wireframe is a schematic or blueprint that is useful for helping you, or your stakeholders to think, communicate and review about the structure of the platform you're building.
### Why are we Showcasing Wireframes?
* **Wireframes make it clear that this is not the final design** : No one could mistake a wireframe for the final look and feel of your application. Low-fidelity and few colors force you to focus on structure over details. There will be lots of time for visual design once the structure is finalized.
* **Wireframes convey that “this is all up for discussion”** : The rough feel encourages discussion. We call it a look no one is afraid to criticize. Wireframes are really quick to make, so don't be shy with giving feedback! Each screen probably only took a few minutes to make; don't worry, their author won't mind doing them over from scratch. What matters the most at this point is the final ease of use, so going through a few iterations is normal and expected.
* **Wireframes make it clear that no code has been written yet** : If a stakeholder received some screens that looked like screenshots of the final app, instead of a wireframe, they might assume that all the code behind those screenshots had already been written. This is most often not the case. Wireframes don't have this danger.
### Suggested Wireframes
#### By View
{% tabs %}
{% tab title="Map View" %}
> `Aimed at Attainment Advisors and Quality Improvment Teams.`

{% endtab %}
{% tab title="Region View" %}
> `Aimed at Quality Improvment Teams and Educational Psychologists.`

{% endtab %}
{% tab title="School View" %}
> `Aimed at Head Teachers and Educational Psychologists.`

{% endtab %}
{% endtabs %}
#### By Function
{% tabs %}
{% tab title="Comparator" %}

{% endtab %}
{% tab title="Explorer" %}

{% endtab %}
{% endtabs %}
{% hint style="info" %}
The wireframes are currently undergoing a feedback process from the stakeholders.
{% endhint %}
# Platform Architecture
The techology architecture for the suggested platform has been driven by the understanding through the following threads:
* Intention and Objective of the suggested new platform and how it's functionalities have been inspired by the landscape of existing tools.
{% content-ref url="/pages/LPvrfjwcHk3nMoTPFzOj" %}
[Blueprint](/solution/blueprint)
{% endcontent-ref %}
* Possible journeys various stakeholders might take through the platform and how they will engage with various pieces of the solution.
{% content-ref url="/pages/f32XpUwdt5ZV0uHt5uuU" %}
[Personas and Journeys](/solution/personas-and-journeys)
{% endcontent-ref %}
* The features of individual pages of the platforms, the challenges they are addressing and the ways a user can manouver through the information.
{% content-ref url="/pages/kM82P2nTBrDGk528F72O" %}
[Wireframes](/solution/wireframes)
{% endcontent-ref %}
Based on these inputs, the architecture has four basic components:
* Data Sourcing
* Data Storage
* User Facing Portals
* Monitoring and Analysis

> **`Suggested Stack`**
| | |
| --------------------------- | ----------------------------------------------------------------------------------------------------------------- |
| Processors and Transformers | [Rust](https://www.rust-lang.org/) |
| Infrastructure | [AWS](https://aws.amazon.com/) |
| Scripts | AWS Lambda
Python
|
### Components
#### Data Sourcing

Based on the requirments of the stakeholders from a new and the possible datasets in scope identified by the University of Strathclyde through their research, the system would support sourcing of data from three different processes:
1. Direct bulk upload of datasets by system maintainers.
2. Data collected on ground through primary data collection methods.
3. Data periodically updated via automated processes through APIs.
#### Data Storage

To support the various sources of data, the system contains various data storage capabilities at different levels of the platform.
* Each component in the system would have a temporary storage to enable faster data access and processing.
* All datasets are stored pre and post processing to enable higher resilience against data loss.
* The central datastore manages the processing, indexing, caching and archival of data.
* A knowledge graph of all the base truths in the system is maintained to enable information mapping against mutiple data sources.
> **`Suggested Stack`**
| Function | Technology |
| ----------------------- | --------------------------------------------- |
| Realtime Storage | [Redis](https://redis.io/) |
| Relational Database | [PostgreSQL](https://www.postgresql.org/) |
| Non-Relational Database | [Apache CouchDB](https://couchdb.apache.org/) |
| Object Store | [AWS S3](https://aws.amazon.com/s3/) |
| Cache | [Redis](https://redis.io/) |
#### User Facing Portals

Catering to the requirements of the key stakeholders, these are some of the components of the user facing portal:
* **Information Portal** : Pre-set of landing pages, visualisations and more catered to the requirements of each of the key stakeholder buckets.
* **Data Catalog** : Repository of the all datasets available on the plaform to various users based on their access rights to explore, visualise, share and more.
* **Data Stories** : Capability to use existing data and visualisations, and stitch naratives around the same which can be published on the platform.
* **Community Portal** : A central portal for variopus stakeholders of the communicy to come together, share relevant information and support each other in build capacity.
* **System Moderation Control Panel** : Management of various system components of the platofrm like analytics, access, usage patterns and more.
* **Data Management Platform** : Access platform available to key data fiduciaries to provide access to relevant datasets based on requirements and eligibility of the users.
#### Monitoring and Analysis
The system would be equipped with central monitoring system to monitor workflows between all the components of the system.
* This system would allow manual interventions and policy enforcement for platform use.
* The processed data will also be available to analyse all the datasets present in the system.
> **`Suggested Stack`**
| Function | Technology |
| ---------------- | -------------------------------------------------------------------------------------------------------------------------------------------------------------------------------------------------------------------------- |
| Dashboard | React
Next.js
ECharts
Typescript
|
| Identity Manager | [Keycloak](https://www.keycloak.org/) |
| Access Manager | [Python](https://www.python.org/) |
| Analytics | [Grafana](https://grafana.com/) |
| Monitoring | [Elastic Stack](https://www.elastic.co/what-is/elk-stack) |
| Administration | [Strapi](https://strapi.io/) |
### Methodology
The key thread across the entire solution architecture is that none the technologies suggested to achieve this solution are proprietory in nature. All the code, tools and technologies produced will be open sourced by default and available under on licenses in public repositories.
# Building Blocks
How do we go ahead from here?
For over six months, we have been engaging with the stakeholders and the education ecosystem at large in the Northern Alliance region of Scotland. Through all these interaction we were able to understand their role and responsibilties, the tools they have at their disposal to help improve the attainment rate in their regions, and most importantly their relationship with data and platforms when trying to achieve their goals.
Through all these interactions, one theme has surfaced more often than any other challenges and aspirations of the stakeholders. The desire for a "One Stop Shop" solution that encompasses all their needs, and creates a single entry point to all the information required for support pupils and understand their needs based on the local context.
### The Opportunity
Existing workflows for many stakeholders comprises of working with data available through current platfroms, individually requesting data files from various offices and collecting information that is unavailable to fill the knowledge gaps. And the challenges don't stop there, as stakeholders then also need to bring the data from all these different sources together and identify the keys insights and trends important for their decision making process.
In such context, a "One Stop Shop" solution holds an immense opportunity to completely transform these existing workflows and create solutions that can bring togehter various aspects of the process onto one central platform. The solution envisionsed should be able to let stakeholders analyse all necessary information to holistically support a child with information like health, socio-economic status, mobility and more providing relevant context.
The platform should also not just stop at that but enable stakeholders to go beyond the insights available and explore further according to their local contexts by bringing different sources of information together. The envisioned solution would also let users save these customised views for internal usage and share key data insights and visualisations with the community at large for knowledge sharing and capacity building.
### Involving the Community
The potential of this opportunity also comes with its challenges. To build the solution as envisioned would mean building consensus within and across several Local Authorities on what the are the challenges we will be addressing. This would mean taking into account their existing plans and priorities, acknowledging the challenges around data sharing agreements, and solving them keeping protection of child privacy at the centre.
In order to achieve the dreams shared by the stakeholders, it will be integral bring the community together when identifying the next steps. The community will play a key role in identifying the direction we chose for the solution and expanding upon their initial requirements. This will also help create a strong investment in the success and adoption of the solution.
### A Phased Approach
The solution as envisioned in its current form would require a substantial multi-party effort to identify which are the factor our work will be focussing on, bring together all the data from the various sources and more.
It will be important to identifty a few key sectors and datasets to begin with and propose a phased plan to approach. Our partners at the Northern Alliance and the University of Stratclyde will play an important role in making these decisions and ensuring validity of our approach.
{% hint style="info" %}
A requirements document will shortly be released as a part of this, which summarises our learnings from the work completed till now and components that will be required to begin work on the development of the solution.
{% endhint %}
# License
This work is released under a [Creative Commons Attribution 4.0 International (CC BY 4.0) License](https://creativecommons.org/licenses/by/4.0/).
**You are free to:**
* **Share** — copy and redistribute the material in any medium or format
* **Adapt** — remix, transform, and build upon the material for any purpose, even commercially.
The licensor cannot revoke these freedoms as long as you follow the license terms.
***
**Under the following terms:**
* **Attribution** — You must give appropriate credit, provide a link to the license, and indicate if changes were made. You may do so in any reasonable manner, but not in any way that suggests the licensor endorses you or your use.
* **No additional restrictions** — You may not apply legal terms or technological measures that legally restrict others from doing anything the license permits.